CTD monitor
Also known as CTD profiler This page attempts to trace a line between history of the CTD profiling instrument, including non-human useage.
Aquapack CTD profiler
A CTD profiler measures the vertical profile of conductivity, temperature and depth through the water column, providing measurements of temperature and salinity, which characterise the water masses in the ocean. This instrument was donated to the HECS by the Brotish Antarctice Survey in July 2023, now being surplus to requirements. It had been used for the early part of the sustained year-round oceanographic measurements from Rothera Research Station, Antarctica, 1997–2017. The Aquapack was made by Chelsea Instruments and rated to 200m.
CTD profile
Picture a column, starting at the surface of the ocean and descending to the ocean floor. Conceptualised by the discipline of oceanography, this is the area delineated for measuring qualities of water, an architecture of modernity.
This logic follows the long history of the way that the seascape has been imagined by different disciplines of Western science. CTD instruments which now rise through these vertical delineations, are preceded by hemp ropes, weighted with lead, which would be dropped from the side of a ship. As the rope dropped, it ran through the hands of the sailors. Knots on the rope, representing fathoms, were called out, and marked down with a quill pen.
Sounding line
“I have been asked by the Captain to try to explain to you as well as I am able, what is the object of our expedition & what we are doing from day to day. I need not remark that it gives me pleasure to do so, for we are to be common shipmates for the next few years & doubtless each one has some interest in the work, the results, if successful, will be creditable to us all. In the first place I must tell you that the bottom of the sea occupies an area of the globe, & this immense portion has been a sealed book to the human race. We have a comparatively accurate notion of the land; we know the geology and the Natural History of much of the countries of the earth, even Africa and Australia are becoming annually more known to us; and the indomitable energy of man is slowly but surely bringing each country into what I may call the regular routine, & causing it to contribute somewhat to the comfort & happiness of the rest; inasmuch as their productions whether natural or artificial, whether as necessary or more generally as (luxuries) are spread in this manner over the world, & in this way conduces to the general happiness of mankind. One reason why our ancestors did nothing towards lifting the soil from the sea bottom was because it was thought that no object could be gained by so doing; and the difficulties in the way were deemed insurmountable. For it was thought, and with reason, that nothing living could exist at a greater depth than about 400 fathoms. Now you all know that when an empty bucket is put over the ships side & allowed to sink down a little distance, what difficulty there is in hauling it up, & what a resistance is offered by the weight of water on the top of it. That resistance increases the lower we go; so that if a man was placed at the bottom...
Lecture by Thompson to crew of Challenger, 1873
Substance of Professor Wyville Thompson's Lecture, to the ship's company of H.M. Ship, Challenger, on the Geography of the sea & the object of the challenger expedition. With remarks on the progress hitherto made. Collection: Scripps Institution of Oceanography Letters, Clippings, Ships' Logs </ref>”
Wildlife oceanographers
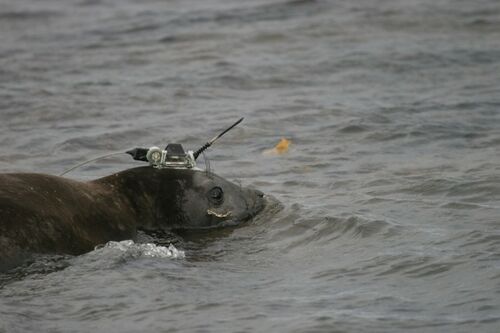
This is a seal which has been fitted with a CTD sensor.

"The average seal dive profiled by the CTDs went to a depth of 500 meters, with some reaching 2,000 meters. The fist-sized instruments, which are glued to a seal’s head and transmit data when it surfaces from a dive, last for about five months before running out of power. Seals molt each year, shedding the instruments along with their fur.
In order to make this cache of data useful, the researchers put the profiles through extensive quality control and calibration. What comes out the other end is just about as good as the Argo data. To see what this gets us, the researchers used a model that takes in available observations and simulates the global ocean circulation pattern that fits them best. This was done for an 18-month period using only the Argo data, and then again using the seal data as well. The two were then compared to see the difference made by the seal data—showing what we would otherwise miss, in other words.
Including the seal data tended to decrease the temperatures estimated for surface water near Antarctica and increase those farther from shore. Salinity increased markedly to the west of the Antarctic Peninsula and lowered a bit elsewhere.
Some of the most interesting differences relate to sea ice behavior. When seawater freezes, salt is excluded from the crystallizing ice. That makes the remaining seawater saltier and, therefore, more dense. The data collected by the seals showed this being more pronounced, affecting surface water circulation. The sea ice itself was also better estimated by the seal-assisted model, with the output comparing more favorably with satellite observations."

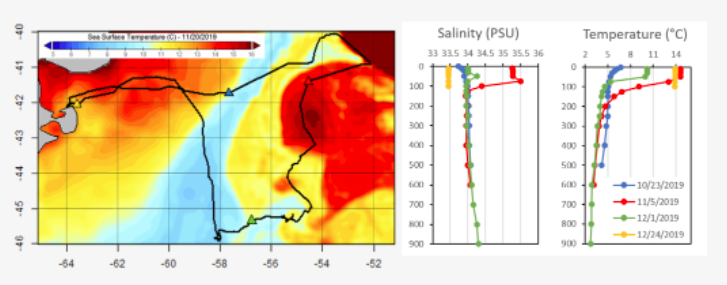
Figure 2—The track of a southern elephant seal tagged with a prototype SCOUT-CTD tag at Península Valdés. The seal migrated east over the course of a month into an area with high salinity, warm-core eddy formed by the Brazil Current before turning back toward the coast. The SST image is from the midpoint of the migration. While temperatures warmed over the two-month period, warmer, low-salinity water near the coast, the northward cold-water current in the center, and warmer high-salinity water offshore were persistent throughout the track. Colored triangles on the map indicate the locations corresponding to the profiles in the right panels.
Suzy Kohin
https://wildlifecomputers.com/blog/promising-field-trial-results-prototype-scout-ctd-tags-transmit-thousands-of-temperature-and-salinity-profiles/
